This article describes how to monitor Docker containers and host performance as well as Docker logs with VictoriaMetrics, VictoriaLogs and Grafana.
It is part of my series on creating a home server on an old laptop. I’m assuming that you’ve set up Docker, Caddy, and Dockge, as described in the first article of the series.
Grafana - Single Pane of Glass #
The most important things to monitor on a home server are performance metrics and logs for both the Docker host and your containers. Performance metrics help you to understand the health of your server and to identify bottlenecks. Logs are important to troubleshoot issues and to understand what is happening on your server.
The ideal solution for a home server is lightweight and easy to set up and maintain. It should also be able to scale with your needs, because you might want to add more monitoring in the future.
Enterprise-grade solution like Nagios or Zabbix are too complex to set up and too resource hungry for a single home server. I ruled these out from the beginning.
The Docker monitoring space is quite crowded. Beszel, despite being pretty new, is doing the best job in my opinion. There is also Dozzle for Docker logs. However, all these tools are single-purpose and don’t provide a single pane of glass for both metrics and logs. That’s where Grafana comes in.
Grafana is a charting software that can visualize data from multiple backends like Elasticsearch, Splunk, or InfluxDB. It is quite popular in the home server community and comes as open-source and enterprise version. The open-source version is fine for a home server and fulfills all my needs: it is easy to set up, has a lot of plugins for future use-cases, and is well documented.
But, Grafana is only for charting. The collected data must be stored somewhere else. I chose VictoriaMetrics and VictoriaLogs for data storage.
Why Not Prometheus and Loki? #
Prometheus seems to be the standard storage for performance metrics on Linux. Loki was developed for logs by Grafana and quickly gained a lot of popularity in the self-hosting community.
I work with Splunk on a daily basis, and found the Prometheus/Loki universe somewhat opaque in comparison. Just the fact that two technologies are needed to collect metrics and logs didn’t sit well with me. It feels like a workaround for a problem that should be solved by one tool.
My colleague went the Loki route, and was not impressed at all by the search language. So I went in search of a suitable alternative and found VictoriaMetrics and VictoriaLogs.
VictoriaMetrics #
VictoriaMetrics (VME) is a time-series database like Prometheus, InfluxDB and many others. What I like about VME is its ease-of-use character. It is a single binary, as it is written in Go (like the aforementioned Beszel), and comes with reasonable defaults. VME is compatible to many popular data collectors like Prometheus or Data Dog. Also, VME is open-source, and the free version has nearly all the features of the enterprise one. Below are the most important VME features (source).
- It can be used as long-term storage for Prometheus.
- It can be used as a drop-in replacement for Prometheus in Grafana, because it supports the Prometheus querying API.
- It is easy to set up and operate:
- VME consists of a single small executable without external dependencies.
- All the configuration is done via explicit command-line flags with reasonable defaults.
- All the data is stored in a single directory specified by the
-storageDataPathcommand-line flag.
- It implements a PromQL-like query language - MetricsQL, which provides improved functionality on top of PromQL.
The documentation also mentions superior performance in comparison to other time-series databases. That’s only interesting when you ingest tons of data, though, which is not the case on home servers. But, it is nice to have.
VictoriaLogs #
VictoriaLogs (VL) is the component for log storage. Yes, I know, with Victoria you also have two solutions for metrics and logs like with Prometheus and Loki, but at least they come under one umbrella and are perfectly integrated out-of-the-box.
Below are the most important VL features (source).
- It is much easier to set up and operate compared to Elasticsearch and Grafana Loki.
- I can confirm that for Elasticsearch. The setup is a nightmare, even with community efforts like docker-elk.
- It provides an easy yet powerful query language (LogsQL) with full-text search across all the log fields.
- Powerful is relative, when you come from Splunk. More on that later.
- It can handle up to 30x bigger data volumes than Elasticsearch and Grafana Loki when running on the same hardware. (Nice to have)
- It provides a Grafana plugin for querying logs.
Installation #
VME and VL are installed with Docker Compose on my home server. They provide example compose files on their GitHub. I took what I needed from there, changed the networking to work with my Caddy reverse proxy, and configured some data collectors.
The result can be found in my blog-victoria-metrics repository.
Components #
The following components (containers) and configs are included in the compose file:
- vector: Vector is Data Dog’s log collector. It collects log files and sends them to VL. I use it to send Docker logs to VL. Read on for more information.
- victorialogs: The container for VL. Data is stored in
./vldata. - victoriametrics:
- The container for VME. Data is stored in
./vmdata. - I use VME’s Prometheus integration to collect metrics via
./prometheus.yml.
- The container for VME. Data is stored in
- grafana: used for charting. VME and VL are added as data sources automatically.
- vmauth: is a router and balancer for HTTP requests. It proxies query requests from
vmalertto either VME or VL, depending on the requested path. - vmalert: executes alerting and recording rules. Five examples are added automatically to play around with.
- alertmanager: receives alerting notifications from
vmalertand distributes them according to--config.file. Nothing is set here by default. You must add your own destinations like SMTP or similar. - node-exporter: adds performance monitoring for the Docker host.
- cadvisor: adds performance monitoring for Docker containers.
Clone the Repo #
# Make a new folder for VME
mkdir -p /usr/local/data/docker/victoriametrics

# Go to your docker folder
cd /usr/local/data/docker/victoriametrics

# Clone the repo. Note the dot at the end. This will clone in the current dir and not create a "blog-victoria-metrics" subdir.
git clone https://github.com/DominikBritz/blog-victoria-metrics .

# Change Grafana folder permissions
chown -Rfv 472:472 grafana

# Create a copy of the .env.template and fill out the variables
cp .env.template .env
Change the GRAFANA_URL variable according to your domain. Make sure it’s the same URL as you choose in the Caddy section in a bit.
Data will be retained until the configured time or space settings are hit - whatever comes first.
# .env
GRAFANA_URL=https://grafana.domain.com # Grafana outside container
RETENTION_PERIOD=30d # Data retention - time
RETENTION_MAXDISKSPACE=30Gib # Data retention - space
VLDATASOURCE_VERSION=v0.13.2 # New release: https://github.com/VictoriaMetrics/victorialogs-datasource/releases
CADVISOR_VERSION=v0.49.2 # New release: https://gcr.io/cadvisor/cadvisor
VECTOR_HOSTNAME=homeserver # Name that should appear as hostname in Grafana dashboards
Let’s Encrypt Certificate via Caddy #
Caddyfile #
Add an entry for Grafana to Caddyfile (details). VME and VL come with their own web interfaces, but they don’t have any benefit over using Grafana.
grafana.{$MY_DOMAIN} {
    reverse_proxy grafana:3000
    tls {
            dns netcup {
                    customer_number {env.NETCUP_CUSTOMER_NUMBER}
                    api_key {env.NETCUP_API_KEY}
                    api_password {env.NETCUP_API_PASSWORD}
            }
                propagation_timeout 900s
                propagation_delay 600s
                resolvers 1.1.1.1
    }
}
DNS A Record #
Add the following A record to your DNS domain:
grafana.home.yourdomain.com 192.168.178.254 # replace with your Docker host's IP addressReload Caddy’s Configuration #
Instruct Caddy to reload its configuration by running:
docker exec -w /etc/caddy caddy caddy reloadStart the Stack #
In Dockge, click Scan Stacks Folder in the user menu top right. The victoriametrics stack should appear in the list.
Deploy the stack through the Dockge UI. Check the terminal window for any errors.
Login With OIDC #
If you prefer logging in with OIDC, checkout my colleagues article on OIDC with Grafana.
Monitoring With Grafana #
Grafana has a central store for dashboards. You can add dashboards by ID by browsing to Dashboards > New > Import. Below are the dashboards I found most useful:
| Purpose | Dashboard name | Dashboard ID |
|---|---|---|
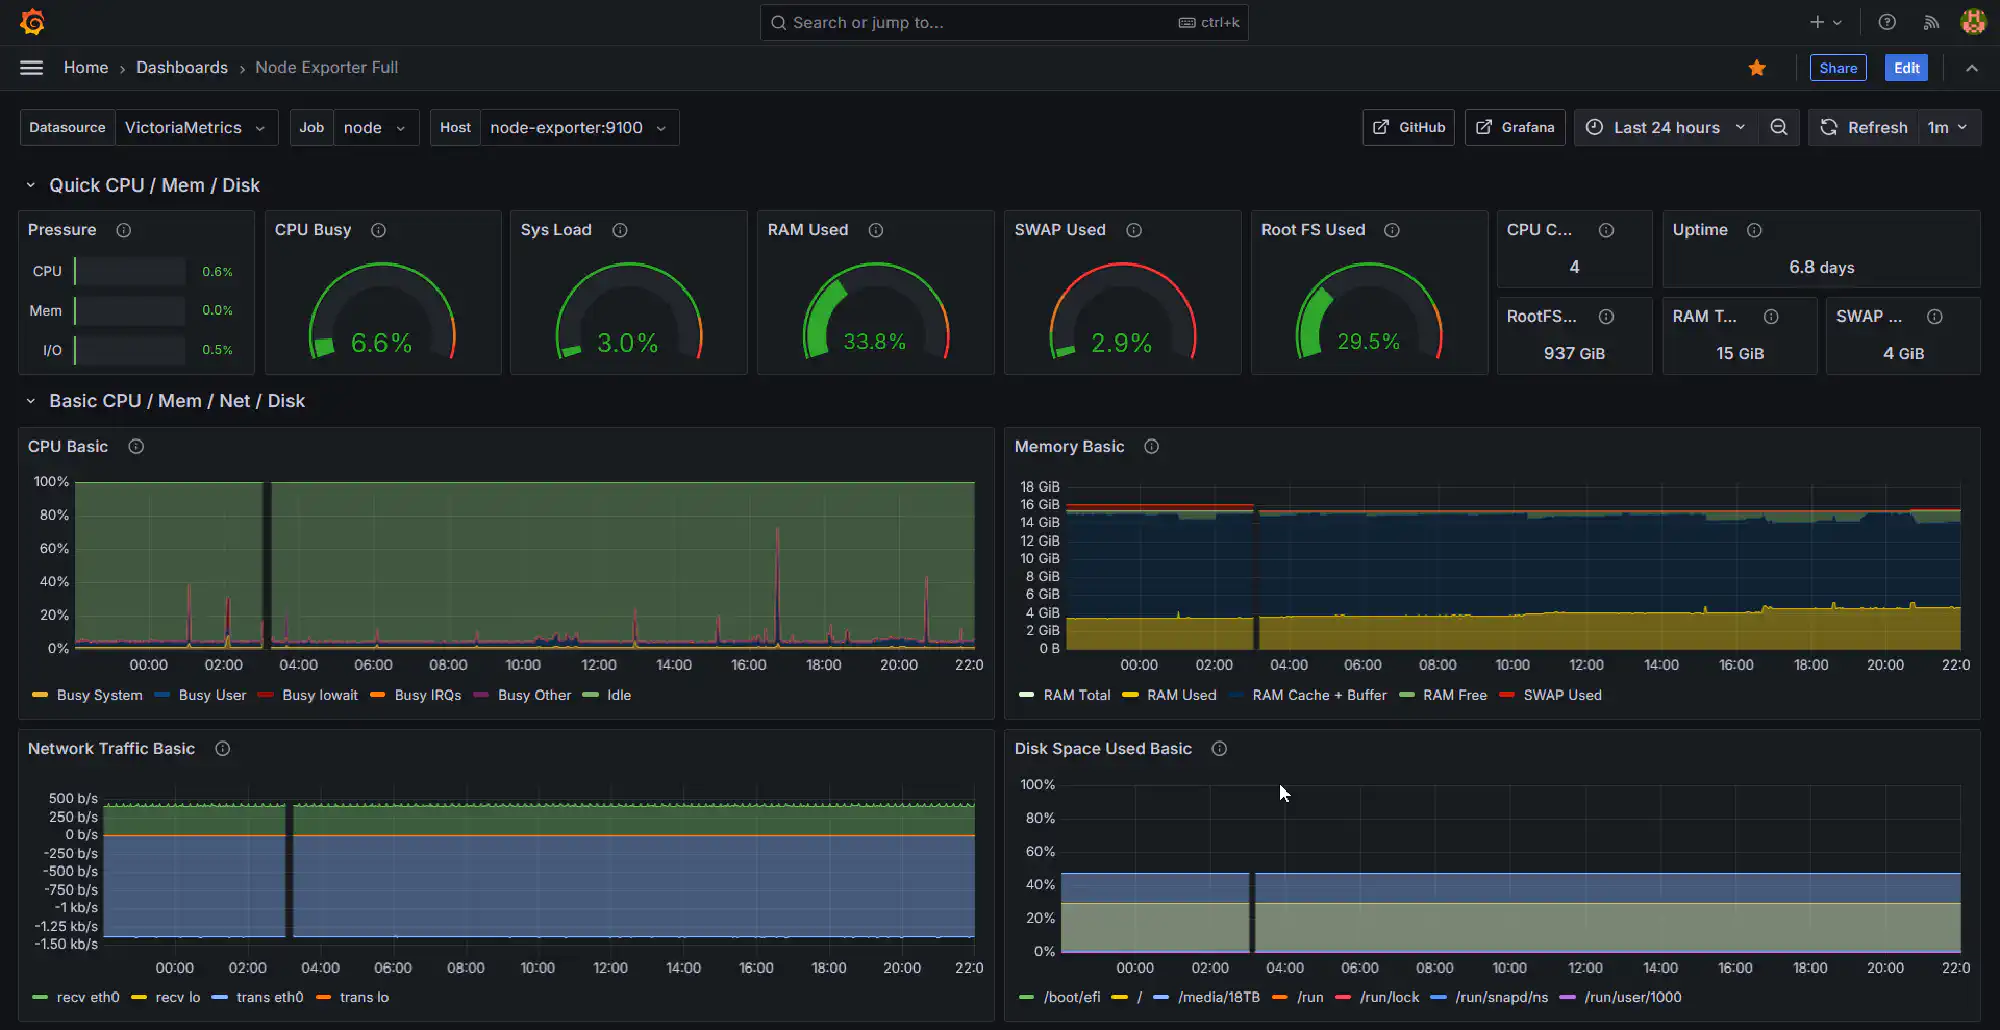
| Docker host | Node Exporter Full | 1860 |
| Docker container | cAdvisor Exporter | 14282 |
| VictoriaLogs instance | VictoriaLogs | 22084 |
| VictoriaMetrics instance | VictoriaMetrics - single-node | 10229 |
Docker Logs #
Node Exporter and cAdvisor both create metrics and hence use VME. For Docker logs, we finally need VL as we’re looking to ingest text.
I could not find any dashboard for Docker logs for Grafana, so I created one. You can find it here or import it with the ID 22593.
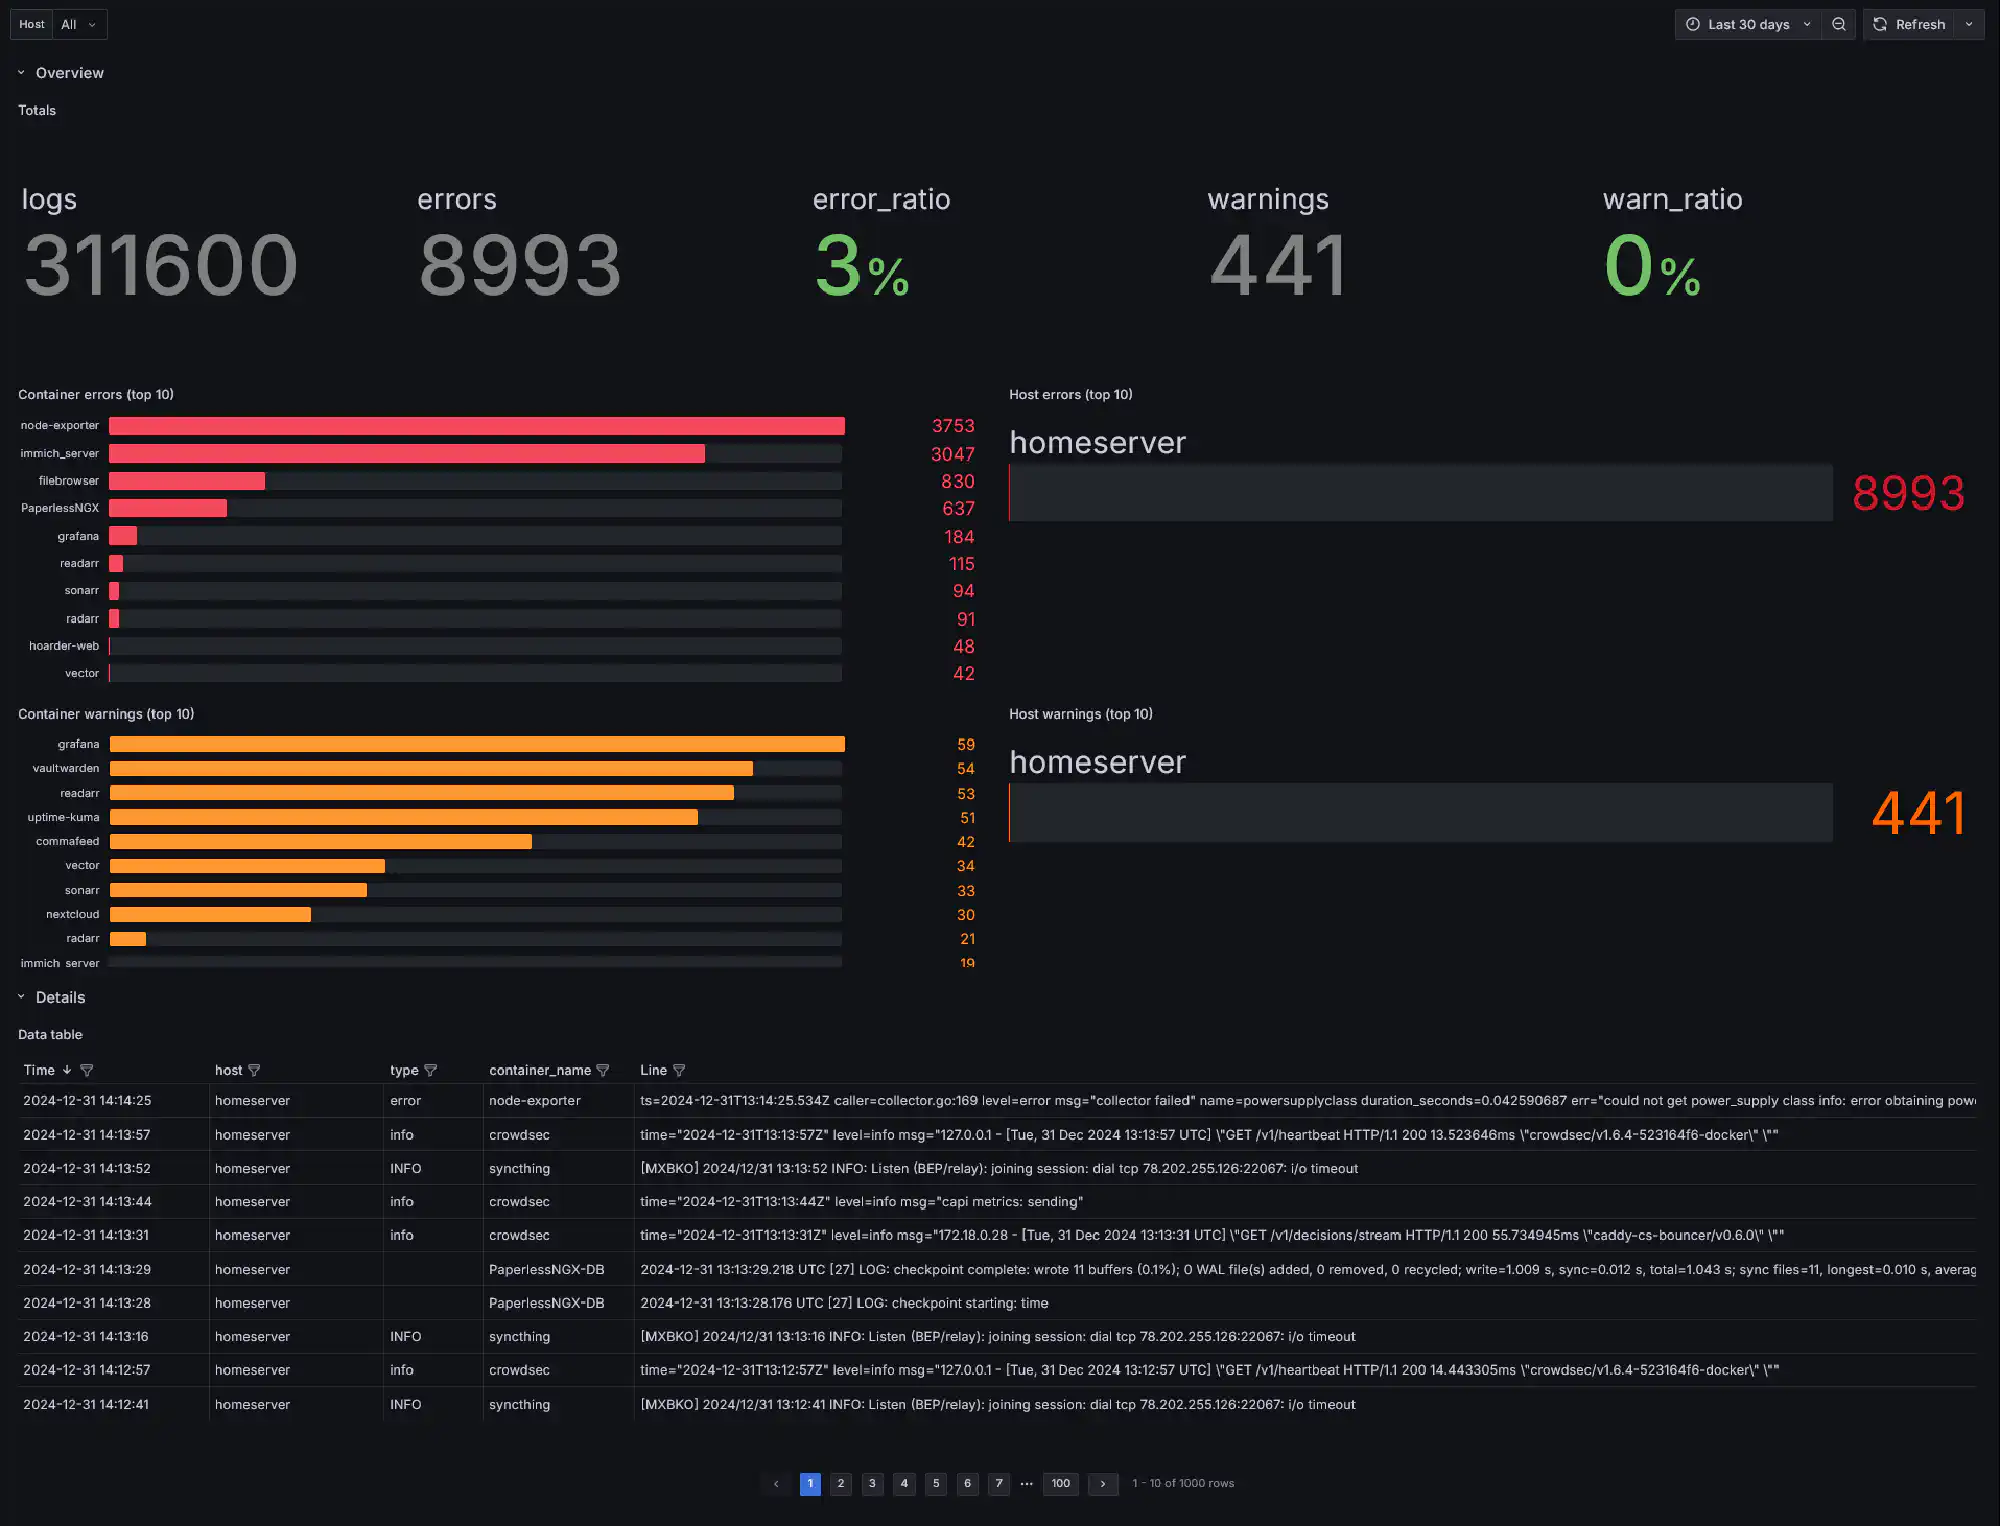
At the top the dashboards shows the total numbers of logs, errors, and warnings, as well as error and warnings ratios. Below, you see the top 10 error and warning producers by container and host.
At the bottom is a table that lists all logs. You can filter the table by each column, which allow you take a look at certain containers, hosts, log types, and even parts of the log messages. This is a standard functionality in Grafana, which I now sorely miss in Splunk.
My Thoughts on LogsQL #
The VictoriaLogs team describes their query language LogsQL as easy yet powerful. When you must work with the awful Loki LogQL language, that might be true. But if you use Splunk as a comparison, the language is still in its infancy.
Below is the LogsQL query that powers the table. I wanted to extract the log type with a case-insensitive regular expression. That is not available in LogsQL. As a workaround, I had to use a capture group with multiple casing options per log type. Not only becomes the search unnecessary long, it also might be inaccurate if some clever developer uses eRror in their messages.
source_type:="docker_logs" host:=$host | extract_regexp "(?P<type>error|ERROR|Error|warn|WARN|Warn|info|INFO|Info|debug|DEBUG|Debug)" | sort by (Time desc)I’ve only created a very simple dashboard, and already ran in the above issue. I doubt this is production ready in its current form for large enterprises. Nevertheless, it is a solid base to expand on, and I’m curious what LogsQL has to offer in the future.
Update: I was wrong. The above query is not necessary. The LogsQL query below does the same job in a much cleaner way.
source_type:="docker_logs" host:=$host | extract_regexp "(?P<type>(?i)error|warn|info|debug)" | sort by (Time desc)I’ve updated my Grafana dashboard accordingly.
Summary #
I was looking for a lightweight and easy-to-maintain yet flexible solution for monitoring my home server. That is apparently not available. You either have to go with a single-purpose tool like Beszel or Dozzle, or with a more complex solution like I’ve built. I chose the more complex solution, because I prefer the flexibility vs. the limited feature set of single-purpose tools.
I found VictoriaMetrics and VictoriaLogs more reasonable than Prometheus and Loki, but it’s not a huge difference to be honest. The Grafana integration is a big plus, and the performance is good. The query languages are not as powerful as I’m used to with Splunk, but they are good enough for a home server.
Changelog #
- 2025-01-21
- Updated the LogsQL query in the Grafana dashboard section